


The case of the missing boiler fuel
Read Time: 6 mins
Written By:
Anuj Choudhary, CFE
You might be familiar with the expression, “past behavior predicts future behavior.” When the phrase is applied in hiring, the thinking goes that a job seeker’s past successes (or failures) can help determine a candidate’s potential to thrive in an organization. The candidate’s resume or CV, behavioral interviews (interview questions designed to learn about a job candidate’s past work experiences), and recommendations from past supervisors serve as the dataset from which hiring managers can see the indicators of success — and potential red flags that suggest: “Do not hire.”
Looking to the past to inform the future isn’t only in the purview of hiring managers. Fraud examiners also rely on past knowledge in their efforts to detect fraud, leveraging data from previously documented cases to detect patterns and anomalies in transactions and processes that could indicate fraud. But these historical datasets are only effective as they’re available. If an organization is upgrading its technology and implementing new software — or looking for novel frauds that wouldn’t be recognizable with existing datasets — fraud examiners will need detection methods that can handle the unknown. This is where machine learning, and specifically “unsupervised” machine learning, can be an effective tool for detecting fraud.
At a time when fraudsters are becoming increasingly sophisticated in their use of technology to perpetrate their schemes, fraud fighters must be steps ahead of the criminals. Machine learning, an offshoot of AI that that uses computers to mimic how people learn and completes tasks without human guidance, can be a powerful tool when you don’t have the requisite data to inform fraud detection.
In this article, we describe how machine-learning models can be used for fraud detection if you’re not sure what you’re looking for. We demonstrate how effective two different types of machine-learning models — supervised and unsupervised learning — are in their abilities to detect anomalies and patterns indicative of fraud. We also describe other advanced data analysis technologies that you might consider implementing to more accurately and efficiently safeguard your organization from fraud.
At a time when fraudsters are becoming increasingly sophisticated in their use of technology to perpetrate their schemes, fraud fighters must be steps ahead of the criminals.
Machine learning employs algorithms and statistical analyses to search for patterns and make inferences about data. It’s how online retailers like Amazon can suggest what you should buy based on what you’ve purchased in the past. In this instance, retailers use supervised machine learning to train algorithms to classify data and predict outcomes. Supervised machine learning relies on known, or labeled, datasets to identify patterns. However, there’s another type of machine learning capable of dealing with unknowns. Unlike supervised-learning algorithms that require data labeled by humans to guide them in learning from datasets to make predictions and adjust as necessary, unsupervised models (as the name suggests) don’t need the supervision of a human programmer to analyze data. Human expertise is still necessary to validate the results, but it can be an effective tool when working without established datasets as unsupervised learning algorithms detect anomalies, patterns and relationships in data without already-documented (prelabeled) examples of fraud.
The following are several unsupervised learning algorithms commonly used for anomaly testing.
As shown in Figure 1 below, the isolation forest model, inspired by the concept of isolating anomalies, operates on the premise that fraudulent transactions are different and occur infrequently. This algorithm can be useful in identifying anomalies by isolating observations and detecting outliers with fewer conditions compared to other methods. It’s suited for use in fraud detection where fraudulent transactions are the outliers within vast datasets of legitimate activities.
The isolation forest model identifies anomalies based on the structure of the dataset itself by isolating each observation in a tree-like structure, randomly selecting features and split values, the values where the branches split, to separate each observation from others. Anomalies are observations that require fewer isolated splits.
Figure 1: The isolation forest.
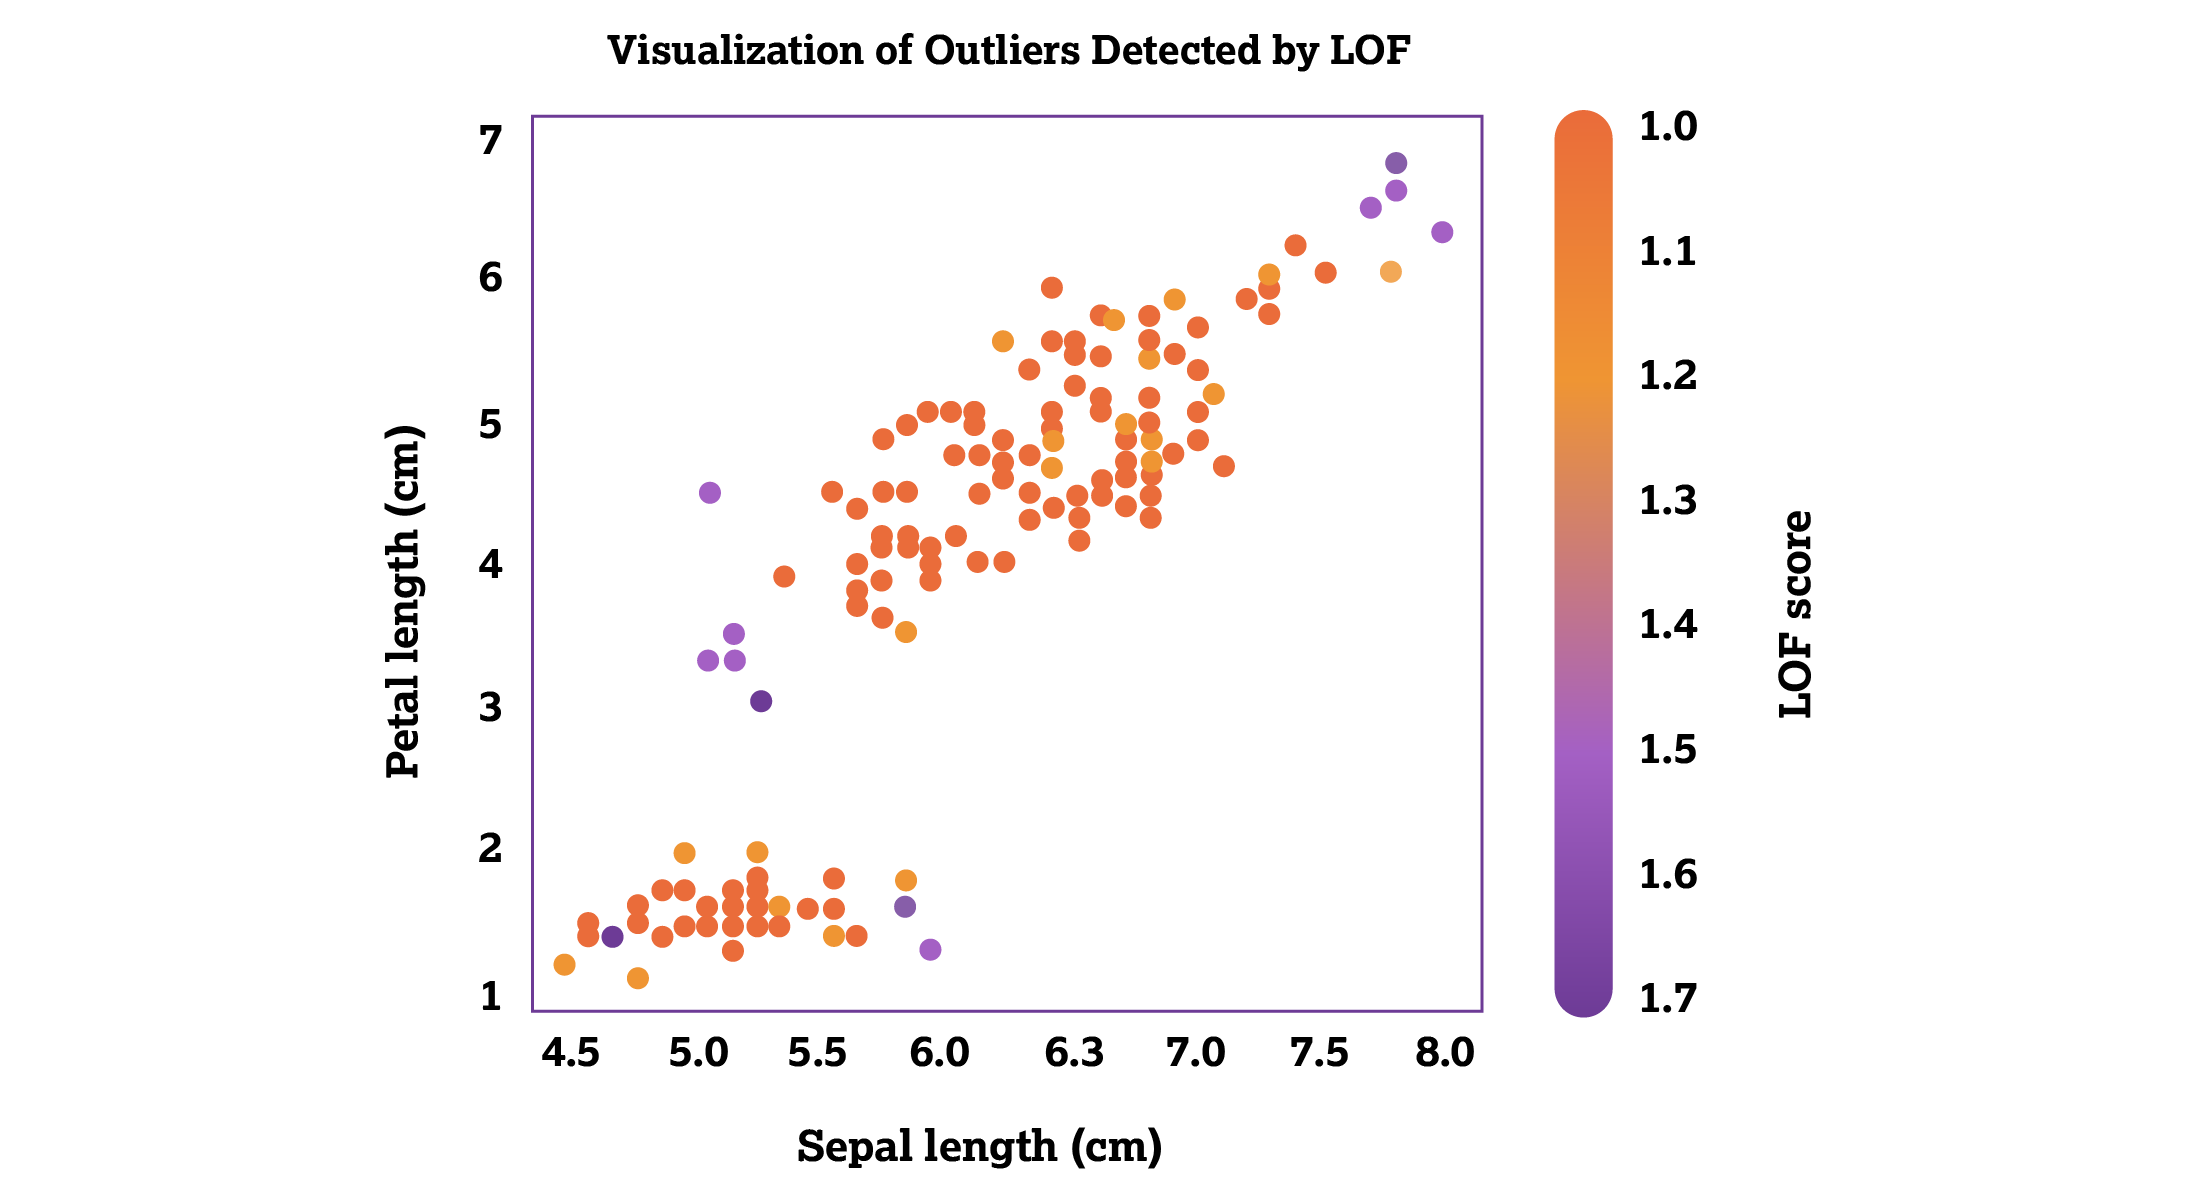
The local outlier factor (LOF) provides a layer of sophistication by measuring the local density deviation of a given data point in relation to its local, neighboring data points. The local density deviation is a measure of distance between data points and how closely they’re packed together. This method assigns an anomaly score to each data point based on its deviation from its neighboring data points by quantifying the local density of those data points. This helps identify potential outliers in a dataset. By focusing on local (data points that stand out in comparison to their immediate neighbors) rather than global anomalies (data points that deviate from the entire dataset), LOF can spot subtle patterns of fraud that might not be detected by other approaches.
Higher local outlier factor scores indicate a greater likelihood that a transaction is an outlier. Figure 2 below is a visual representation of the local outlier factor.
Figure 2: The local outlier factor.
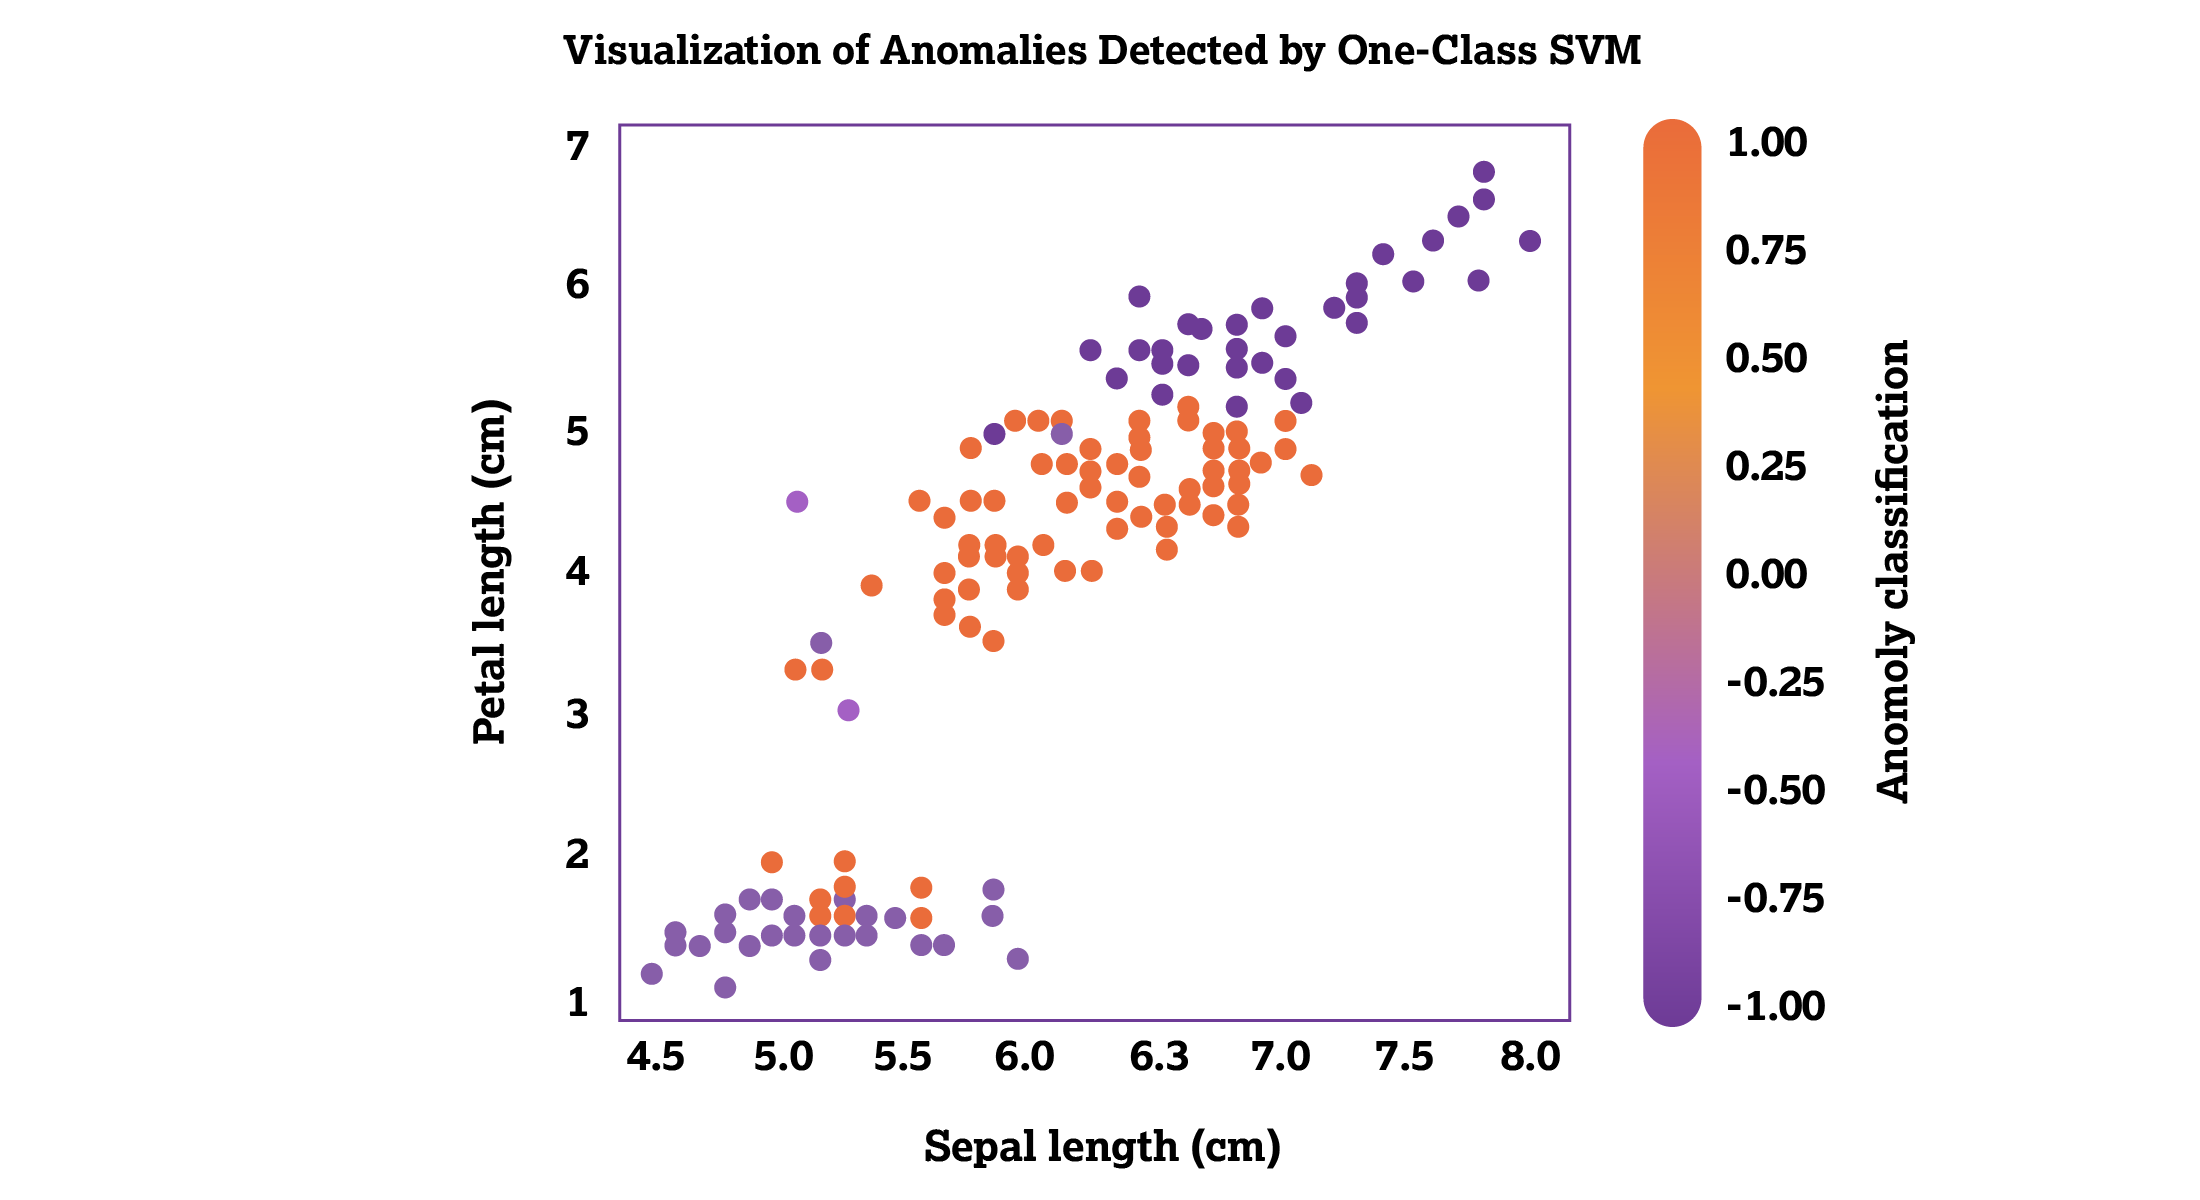
One-class support vector machines define boundaries around “normal” data points. Points that fall outside these boundaries are considered anomalies or potential frauds. This model is particularly useful when fraud patterns aren’t well defined or highly variable, such as sales volume, revenue or unlabeled datasets.
The one-class support vector machine works by trying to find a function that’s positive for data regions with high density among data points, and negative for any other region. As demonstrated in Figure 3, the scale is ordered by values from positive 1 to negative 1. All high-density data points are labeled with values over 0, meaning that they’re positive, and all low-density data points are labeled with values under 0, meaning that they’re negative values.
Figure 3: The one-class support vector machine.
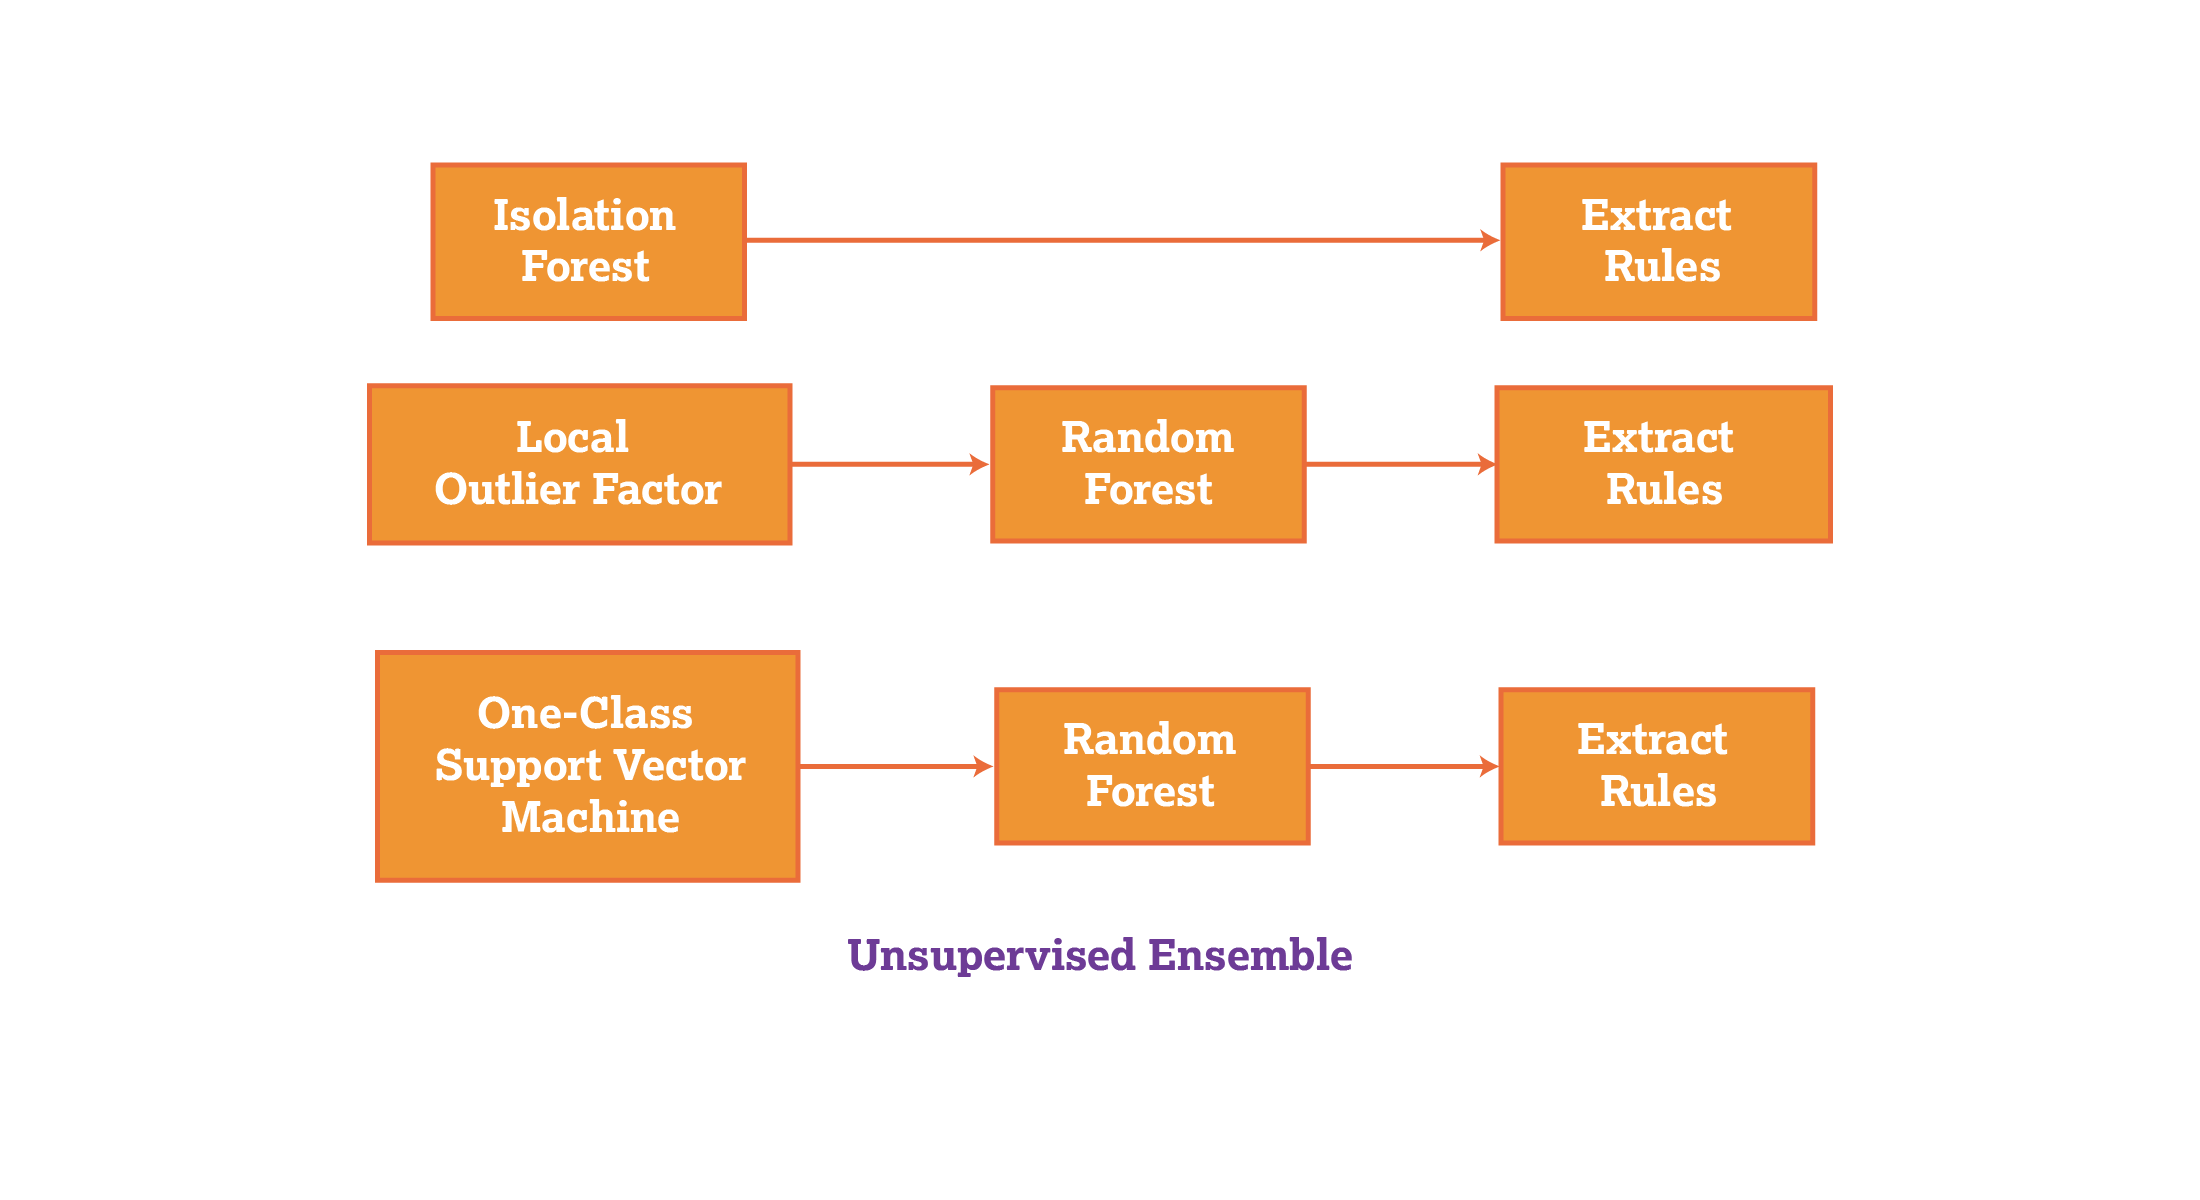
Putting all these models together into an "ensemble" (a collection of models) of machine-learning tools can be powerful for detecting a broad array of fraudulent activities, such as unusual credit card spending, irregular insurance claims, network access at unusual times and theft of inventory, etc. In this article, we use the ensemble approach to evaluate the differences in supervised and unsupervised learning in their abilities to detect anomalies. Below are some of the benefits (and challenges) of the ensemble approach as it’s used in the following supervised-learning models in comparison to unsupervised learning ensembles.
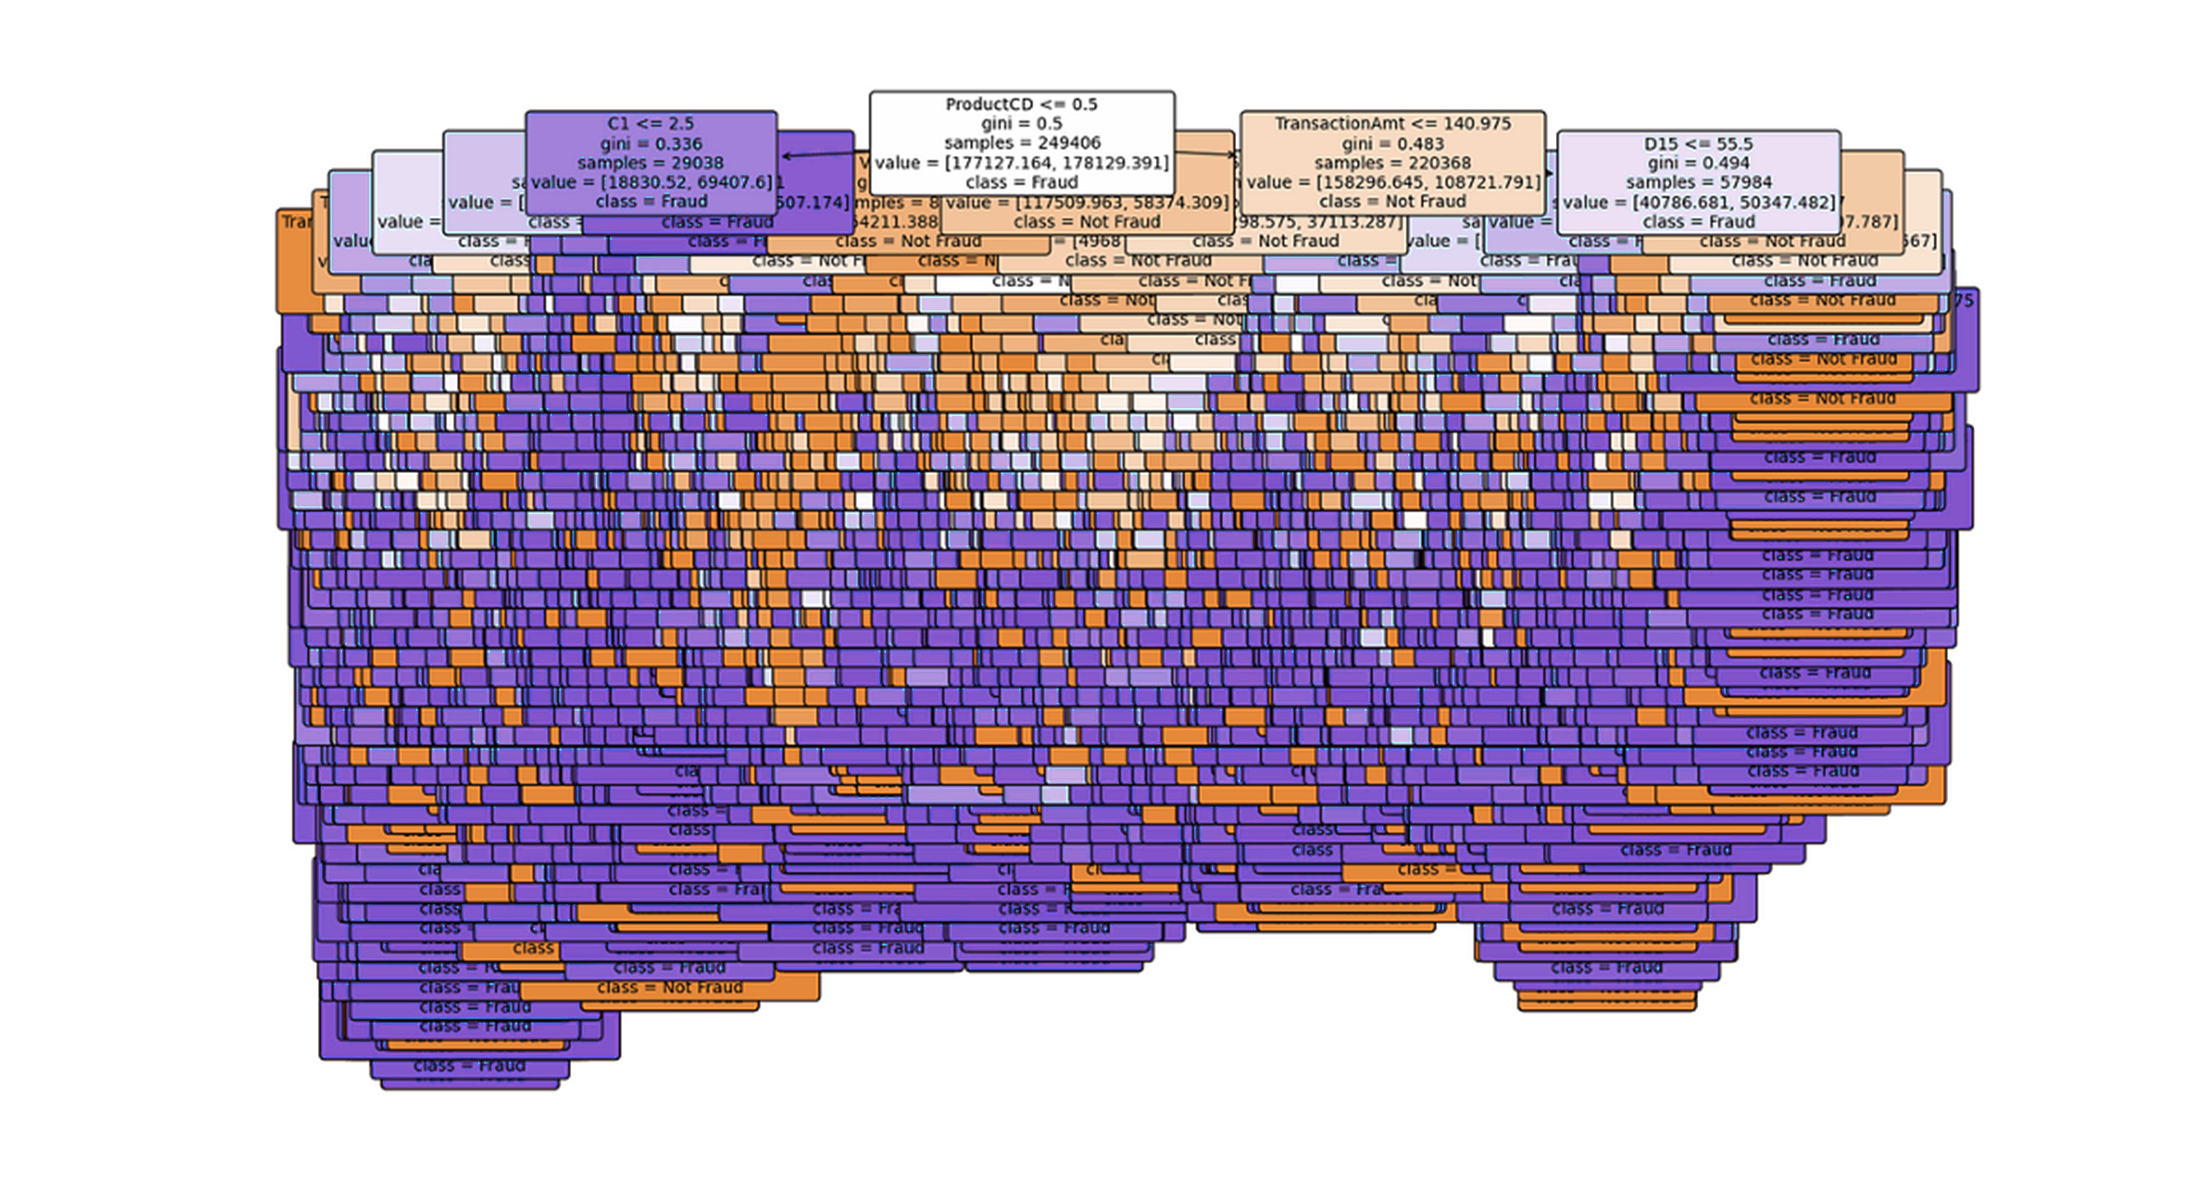
Random forest (Figure 4) is a supervised machine-learning algorithm that can overcome the limitations of decision trees by combining multiple decision tree algorithms. Decision trees start with a single question and branch out into many possible outcomes. Random forest algorithms can overcome overfitting in which a model only performs well with the data it was trained on, and lack of generalization, in which a model performs poorly with data it hasn’t been trained on. Key methods used in random forest ensembles include bootstrapping and feature randomization. Bootstrapping involves randomly selecting subsets of an original dataset and training a decision tree on each subset. This creates diverse trees in the forest, as each tree has a slightly different training set. In feature randomization, a random subset of features is considered for splitting at each node of the decision tree. This helps reduce overfitting and creates a diverse group of trees. Figure 4 below is a model of the random forest.
Figure 4: The random forest model.
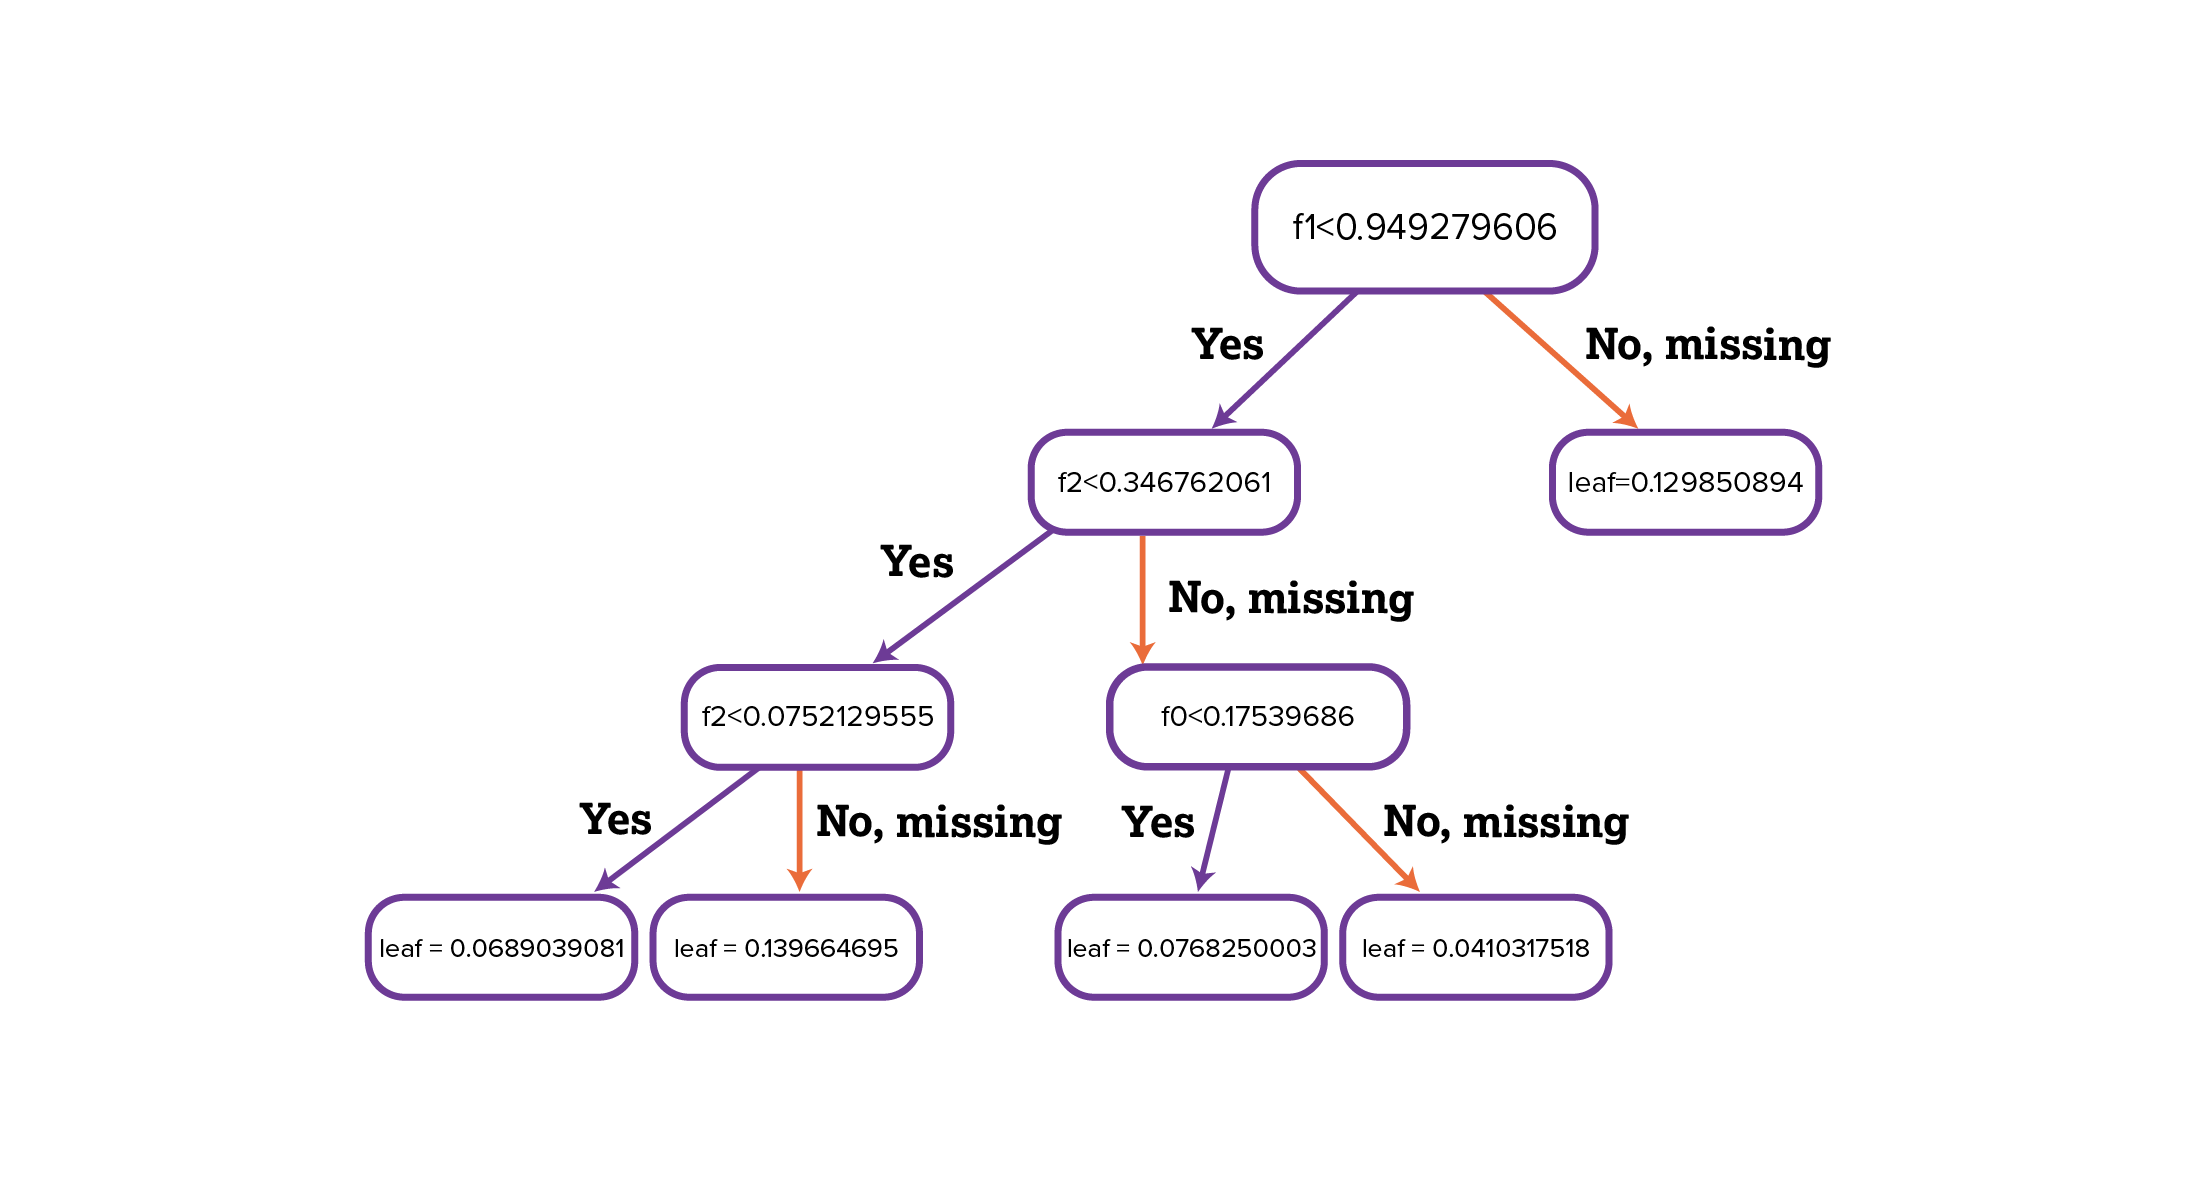
eXtreme gradient boosting works by iteratively adding decision trees to a model. Each new decision tree is trained to correct errors made by the previous decision tree. This algorithm, as seen in Figure 5, uses a trial-and-error approach to adjust the weights assigned to each decision tree in the model to achieve accuracy.
Figure 5: eXtreme gradient boosting.
CatBoost is an open-source library designed to handle categorical and missing data, and boost (combine) decision trees without employing any encoding techniques to convert categorical data to numerical data to proceed with training.
The following experiment compares how effective supervised and unsupervised models are in detecting anomalies. In this experiment, we used the credit card fraud detection dataset on Kaggle, an online community for data scientists that often hosts competitions and provides public datasets.
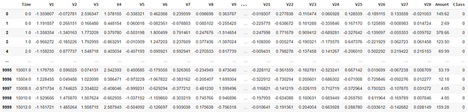
The credit card fraud detection dataset from Kaggle comprises 284,806 credit card transactions with 31 columns of transaction features, including the time of the transaction, amount and class, which indicate whether the data is fraudulent or non-fraudulent. We used Google Colab’s online collaborative codebook platform. Because of Colab’s run-time limitations (computing power limits), we restricted use of the dataset to its first 10,000 rows.
Figure 6 below is a subset of data from Kaggle with 38 fraudulent transactions and 9,962 non-fraudulent transactions. The goal of this experiment was to identify all 38 fraudulent transactions and reduce the number of false positives to the greatest extent possible by prioritizing the rules produced by the supervised and unsupervised models in each ensemble.
Figure 6: Google Colab unsupervised ensemble and subset of transactions with 38 fraudulent transactions and 9,962 non-fraudulent transactions.
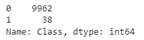
The following confusion matrices in Figure 7 compare the number of predicted values and actual values produced by each supervised-learning ensemble.
Figure 7: Supervised-learning confusion matrices.
As demonstrated in the supervised matrices, the supervised ensemble was able to detect nearly 35 instances of true fraud while keeping the false positive rate at a reasonable range of 170. When all 38 instances of fraud were detected, the false positive rate increased to 2,242.
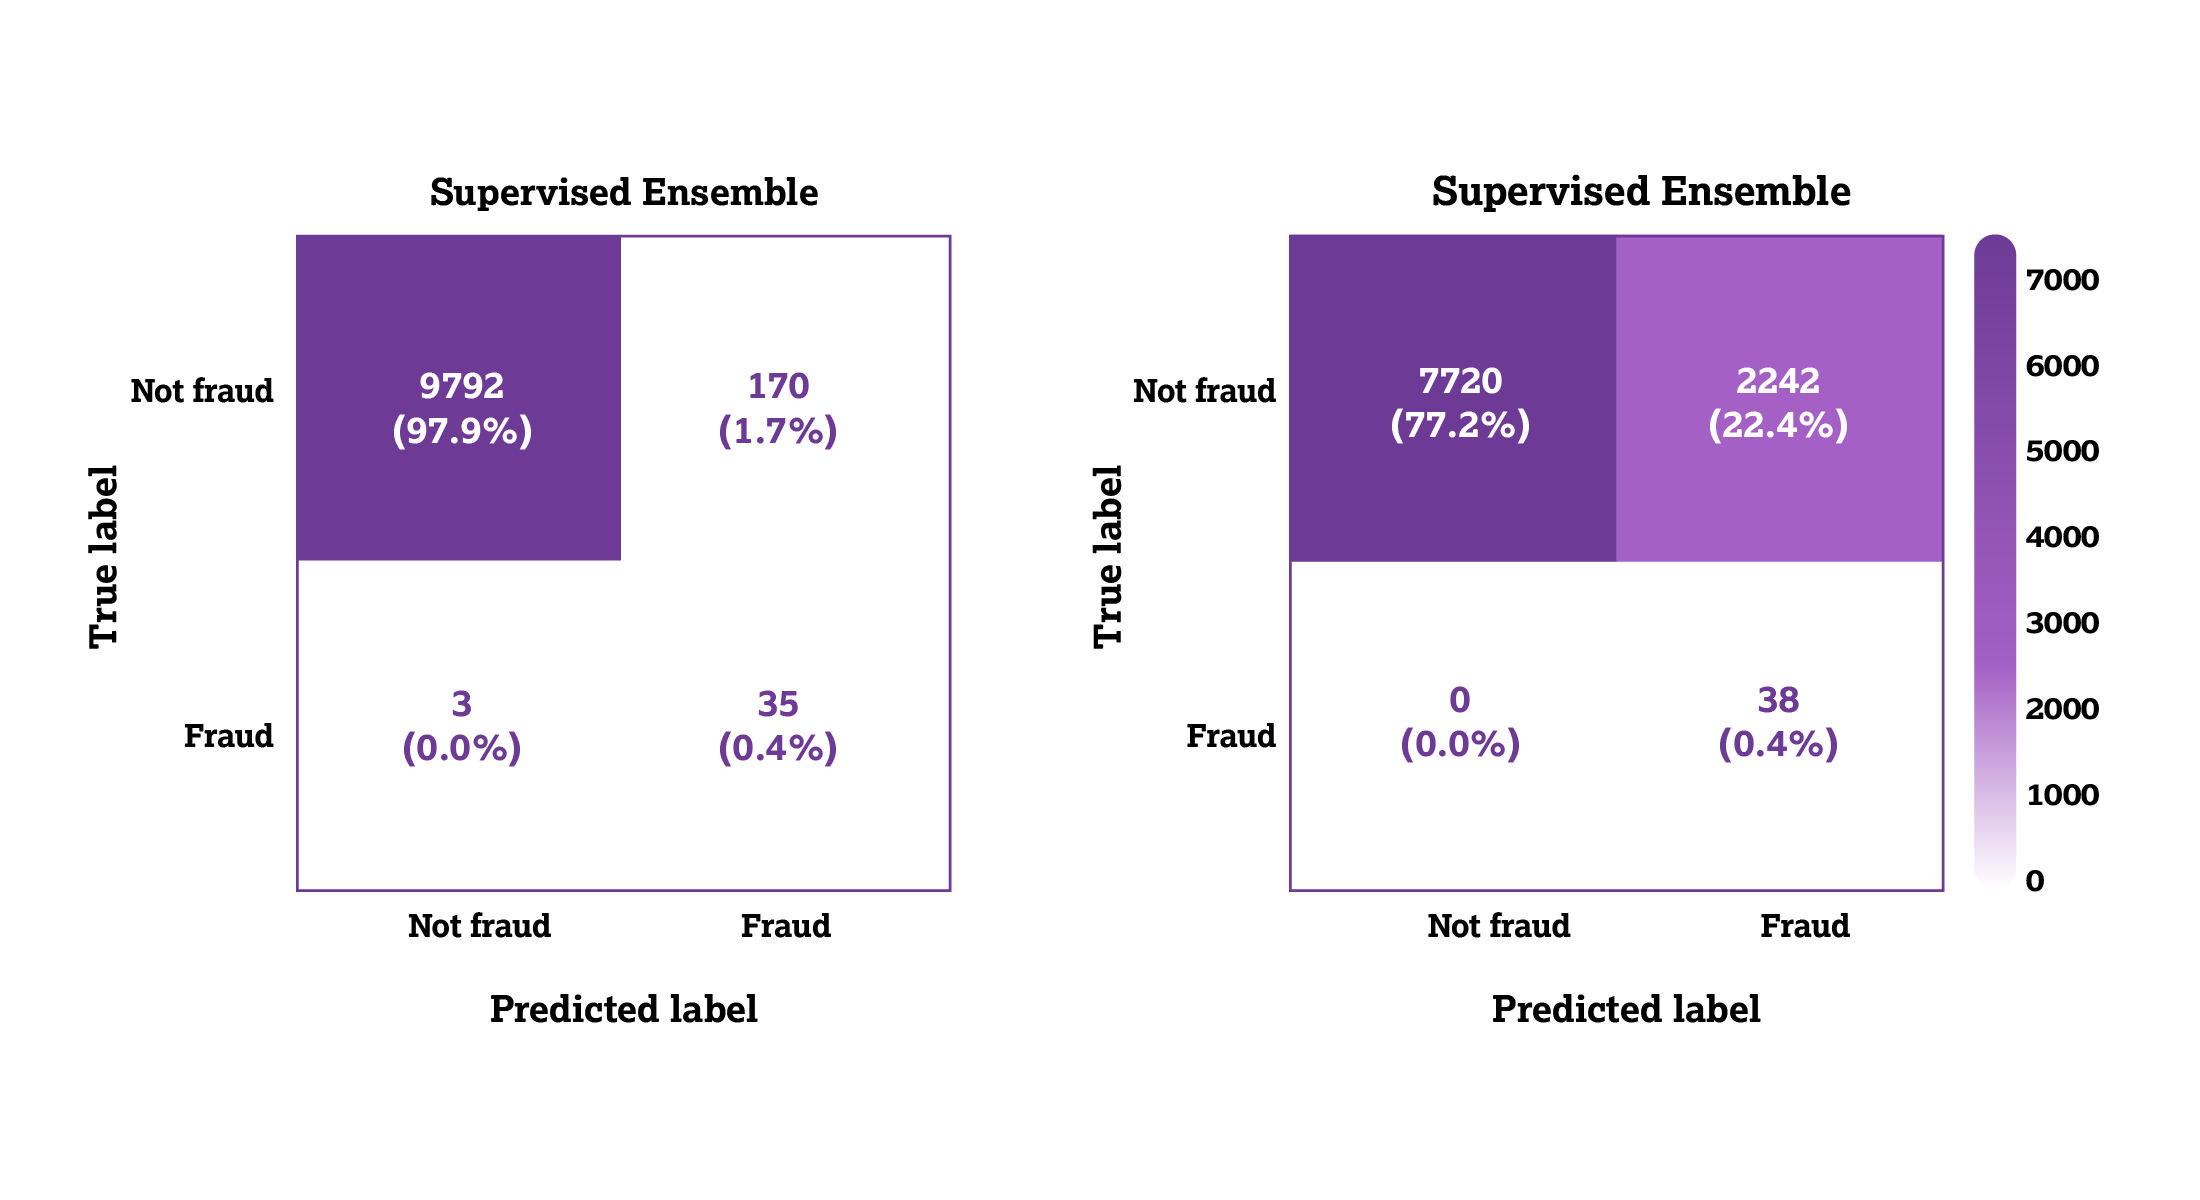
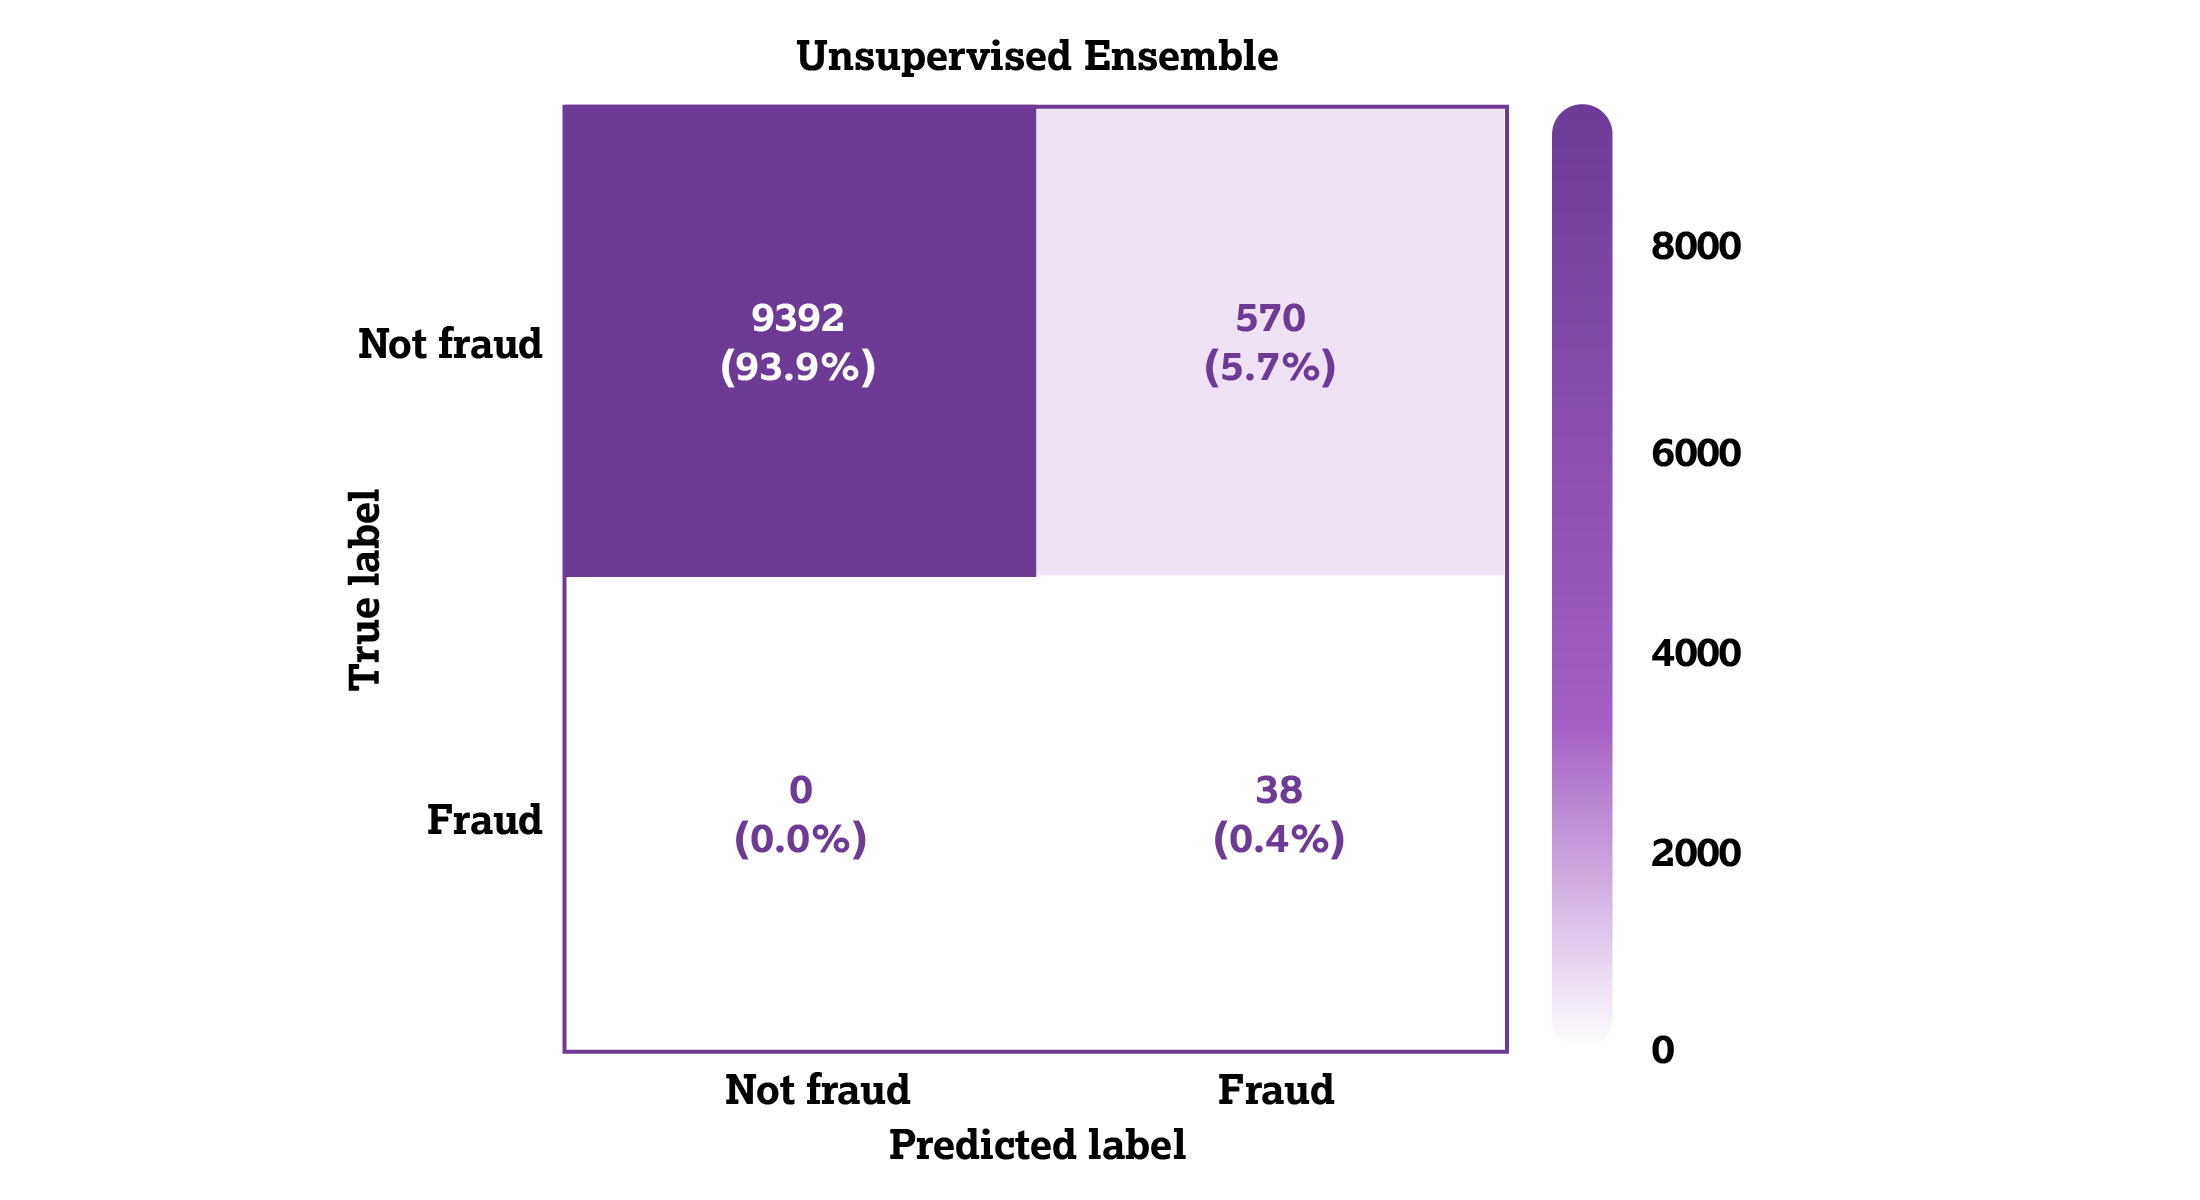
In the unsupervised ensemble (Figure 8), when all 38 instances of true fraud were detected, only 570 instances of non-fraud were classified as fraud.
Figure 8: Unsupervised ensemble matrix.
We used the random forest model for both supervised and unsupervised models to formulate decision trees for the detected anomalies. This allowed rules extracted from the decision trees to be prioritized based on the models’ performances as depicted in the following chart.
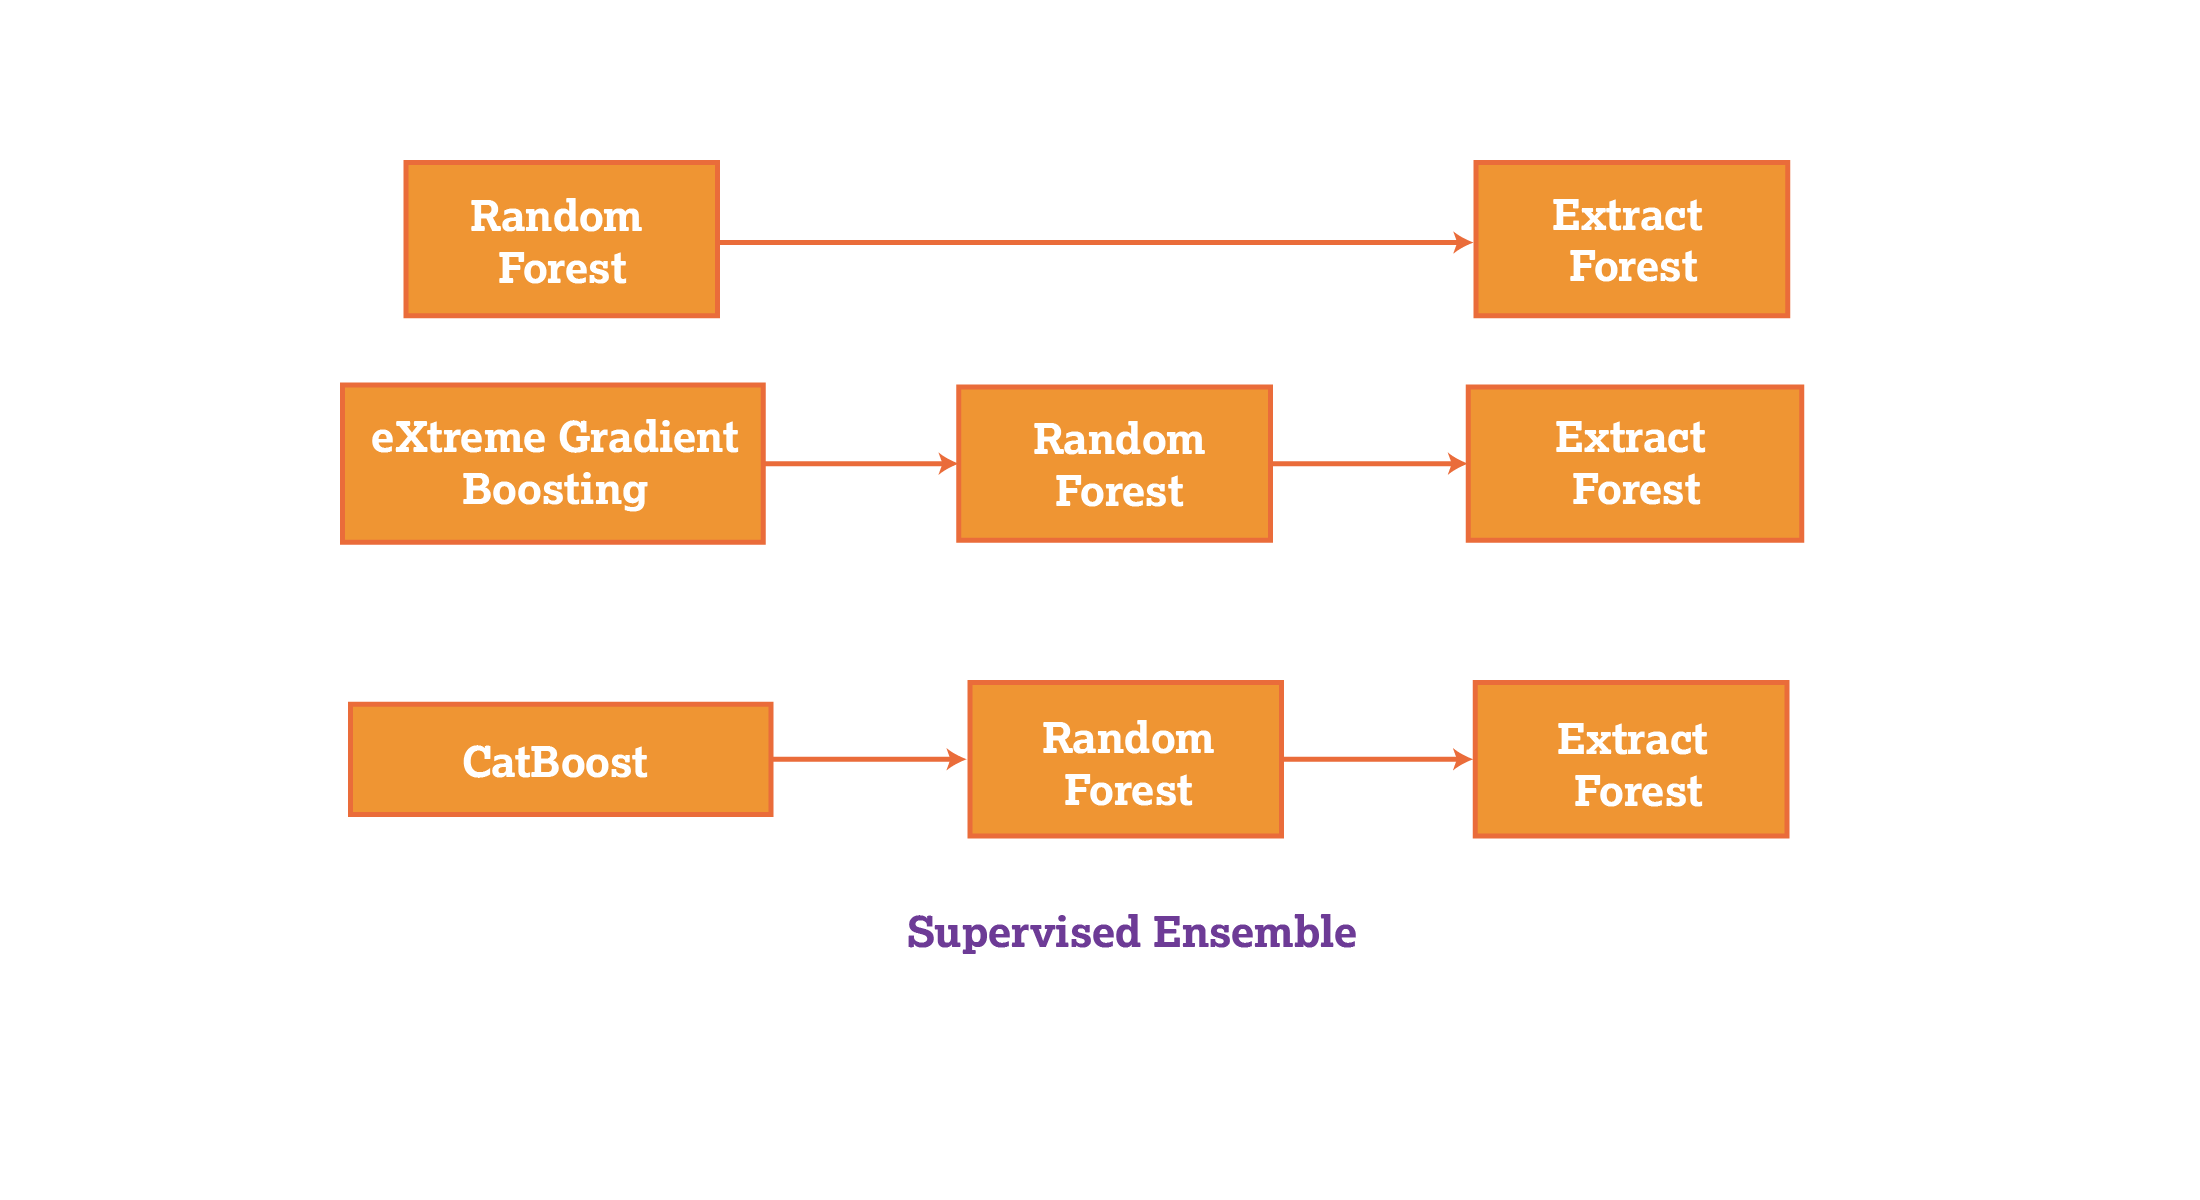
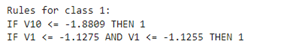
Figure 9 is a snapshot of the extracted rules for the supervised ensemble. A data record with “1”in the “class” column, indicates a fraudulent record. The first rule says if the column V10 is less than or equal to -1.8809 then the data record is classed as fraud. V10 and V1 are columns associated with credit card transactions, indicating amounts, available credit, interest, fees or the minimum payments due for an account.
Figure 9: Snapshot of extracted rules for the supervised ensemble.
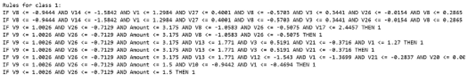
The following chart shows the rules extracted from the unsupervised ensemble. These rules are the decision criteria for classifying a data record as fraud.
Snapshot of extracted rules for the unsupervised ensemble.
In fraud detection with machine-learning models, you’ll need to prioritize rules that models have generated. The z-score is a statistical measure used for anomaly scoring and rule prioritization. It describes a value’s relationship to the mean of a group of values, and it’s measured in terms of standard deviations from the mean. A z-score of “0” indicates that a data point’s score is identical to the mean score. This is the formula:
Z = (X - μ) / σ
Where:
X is the value of the element,
μ is the population mean,
σ is the standard deviation.
As a z-score of 1.0 represents a value one standard deviation from the mean. This method can help identify outliers in a dataset. The following is the code for calculating the anomaly score. It can be read as “anomaly score = a numerical array that is the absolute value of each z-score of instances that satisfy each rule.”
anomaly_scores = np.abs(zscore(instances_satisfying_rule.values, nan_policy='omit'))
To construct the ensemble, we used this line of code to calculate the z-scores for the values in the credit card dataset that satisfied the rules extracted from the models used in this article. The fraudulent data records should deviate from the non-fraudulent data records, meaning that they have a high z-score, according to the code we used.
The z-score function in the code computes the z-score for each value in a row satisfied by a particular rule by subtracting the mean of the column the values are in from those values. Each deviation is then divided by the standard deviation of the column. This calculation “standardizes” the values so that they have a mean of 0 and a standard deviation of 1. This places all rules on a single plain to be compared to determine the most effective rules.
A maximum absolute z-score is then used as the anomaly score for a specific rule. By sorting the z-score across rules, you can identify how to sort the most notable rules. In the supervised ensemble models (i.e., random forest, eXtreme gradient boosting and CatBoost), there were very few false positives compared to true positives, so we had to look for the majority rules instead of the anomalous rules to find the rules that will detect actual fraudulent data records. So, when sorting rules by z-scores, you’ll want to indicate “False” to the “reverse” parameter so that the top sorted rules have the lowest z-scores, sorting from lowest to highest for the z-scores, as shown in the following code:
sorted_rules2 = [rule for _, rule in sorted(zip(rule_anomaly_scores2, filtered_rules2), reverse=False)]
The supervised models had difficulty separating true fraudulent data records from non-fraudulent ones when a certain level of fraud detection is reached. As in the supervised ensemble models below, the threshold was 35 out of 38 true fraudulent records detected. After this threshold is reached, 2,242 records of non-fraudulent transactions would be mixed in with the detected records to have the last three fraudulent records found by the model.
In our experiment, the unsupervised model performed better in controlling the number of legitimate data records mixed in with the fraudulent records, because the algorithms were based on statistical methods rather than patterns from a training dataset.
The z-score isn’t the only metric available for rule prioritization. Other machine-learning metrics include the recall rate, which is the proportion of correctly predicted positive samples out of all actual positive samples, and the F1 score, which measures a model’s accuracy and combines precision and recall scores. It’s calculated as 2 * (precision * recall) / (precision + recall).
Here are the links to the supervised and unsupervised ensembles from Google Colab that we used for this experiment.
The supervised- and unsupervised-learning techniques outlined in this article are just a few methods to consider in your fraud detection program. Other advanced methods may also help address the challenges of detecting unfamiliar or sophisticated methods of fraud.
Deep learning, which is a subset of machine learning that uses artificial neural networks to mimic the human brain, can learn and make decisions with little intervention from a person. Deep-learning models can uncover subtle and complex patterns that rule-based algorithms might miss.
The ability of deep-learning algorithms to process and learn from unstructured data, such as images and text, provides greater opportunities for detecting subtle behavioral or transactional patterns of fraudulent activity. For instance, deep neural networks can analyze transaction sequences to identify anomalies that deviate from a user’s typical behavior, flagging potential fraud with precision.
Deep-learning models like convolutional neural networks (CNNs) and recurrent neural networks (RNNs) hold promise for fraud detection. CNNs are adept at analyzing visual data, which could make them suitable for use in identity verification through document or facial recognition. RNNs can analyze sequential data, such as transaction history, to predict future fraudulent transactions based on past patterns.
When used for fraud detection, deep learning can automatically perform feature extraction. It can identify and select the most relevant features from raw data without human intervention, reducing the time and resources required for cleansing, structuring and transforming raw data. Deep-learning models also continuously learn and adapt to new data, improving their accuracy over time.
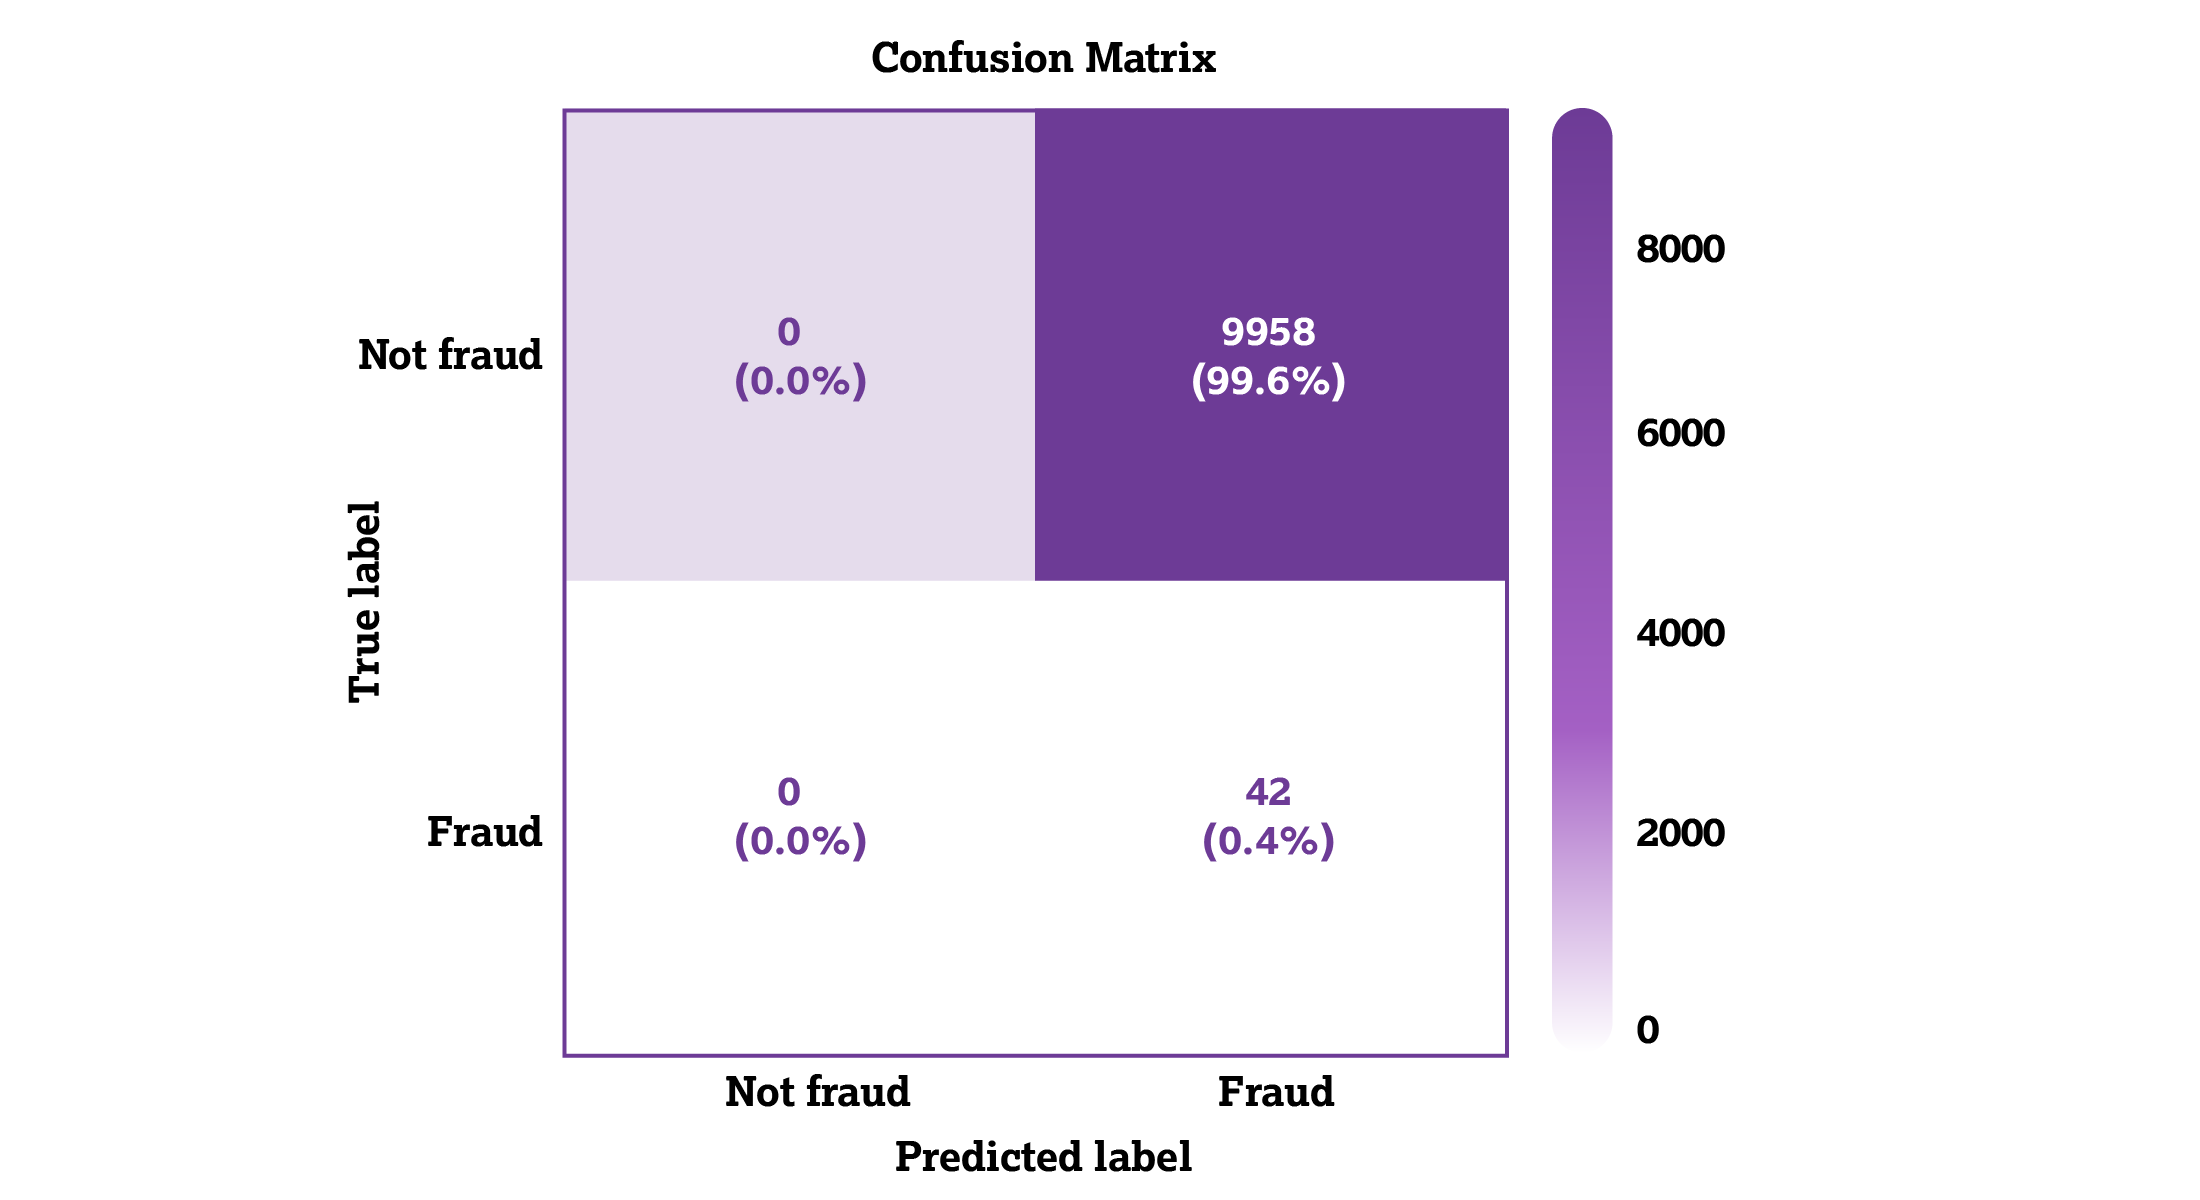
There’s just one caveat with deep learning: It consumes a considerable amount of computing power. In our experiment, we used a multilayer perception classifier, a type of deep-learning artificial neural network. In the confusion matrix below, you can see its shortcomings when there’s limited computing power, as all the data points were identified as fraudulent.
Another advanced technique for fraud detection is big data analysis. The sheer amount of data produced by digital transactions presents both challenges and opportunities for fraud detection, but big data systems can integrate data from diverse sources, such as transaction records, social media activity and mobile device data. We can get a comprehensive view of consumer behavior through big data analytics.
Combining deep learning and big data could enhance the accuracy of fraud detection models and enable them to handle the volume, velocity and variety of digital data.
Digital currencies and blockchain technologies also bring a new set of challenges — and opportunities — for fraud detection. The decentralized nature of blockchain enhances the security and transparency of many financial transactions, but the public’s growing use of cryptocurrency is an opportunity for fraudsters as they become more sophisticated in their schemes involving digital currencies.
The features of cryptocurrency that appeal to the public — anonymity and less regulation than centralized financial transactions — also appeal to criminals. Once a fraudulent transaction is recorded on the blockchain, it can’t be altered or reversed, making proactive detection methods essential. Monitoring for vulnerabilities in smart contracts (digital agreements stored on the blockchain), detecting abnormal transaction patterns and identifying potential security breaches in decentralized finance protocols require sophisticated tools capable of analyzing transactions in real time. Machine-learning models, including unsupervised learning algorithms, show promise in monitoring blockchain networks for signs of fraudulent activity. These models can identify unusual patterns, such as rapid increases in transaction volume or size, which may indicate market manipulations and other fraudulent schemes.
Integrating blockchain analysis into traditional fraud detection systems allows organizations to proactively track the flow of digital currencies, identify the origins of fraudulent transactions and mitigate risks.
Fraud fighters don’t always have all the information they need to accurately identify anomalies and patterns indicative of nefarious activities. While having datasets of past cases of fraud to inform the present is helpful, fraudsters are advancing their techniques and making it more difficult to detect fraud. As the landscape of fraud continues to evolve, so too must the strategies and technologies used to combat it. Fraud fighters must employ advanced technologies to anticipate the unknown instead of relying only on fraud detection methods trained on existing datasets and embrace unsupervised models that stand independent of the past.
The future of fraud detection will depend heavily on the latest technologies like the machine-learning processes described in this article, as well as deep learning, blockchain technologies and big data analytics. Integrating these technologies into anti-fraud programs not only enhances the accuracy and efficiency of fraud detection but also paves the way for the development of even more sophisticated and autonomous systems capable of adapting to new fraud tactics and schemes in real time.
Penny Li, CFE, CPA, is the owner of Apps for Pros and is a graduate of the Master of Forensic and Fraud Examination program at West Virginia University. Contact her at yl00037@mix.wvu.edu.
Ning Ping Wang is a graduate student at Columbia University. Contact her at nw2567@columbia.edu.
Unlock full access to Fraud Magazine and explore in-depth articles on the latest trends in fraud prevention and detection.
Read Time: 6 mins
Written By:
Anuj Choudhary, CFE

Read Time: 15 mins
Written By:
Emily Homer, Ph.D., CFE
Anna Brahce

Read Time: 14 mins
Written By:
Richard G. Brody, Ph.D., CFE
Elena Klevsky, Ph.D., CPA
Ryan Knight
Read Time: 6 mins
Written By:
Anuj Choudhary, CFE
Read Time: 15 mins
Written By:
Emily Homer, Ph.D., CFE
Anna Brahce
Read Time: 14 mins
Written By:
Richard G. Brody, Ph.D., CFE
Elena Klevsky, Ph.D., CPA
Ryan Knight